Hi Cherry Creek. Let’s examine some key real estate metrics that can provide insight into current market trends.
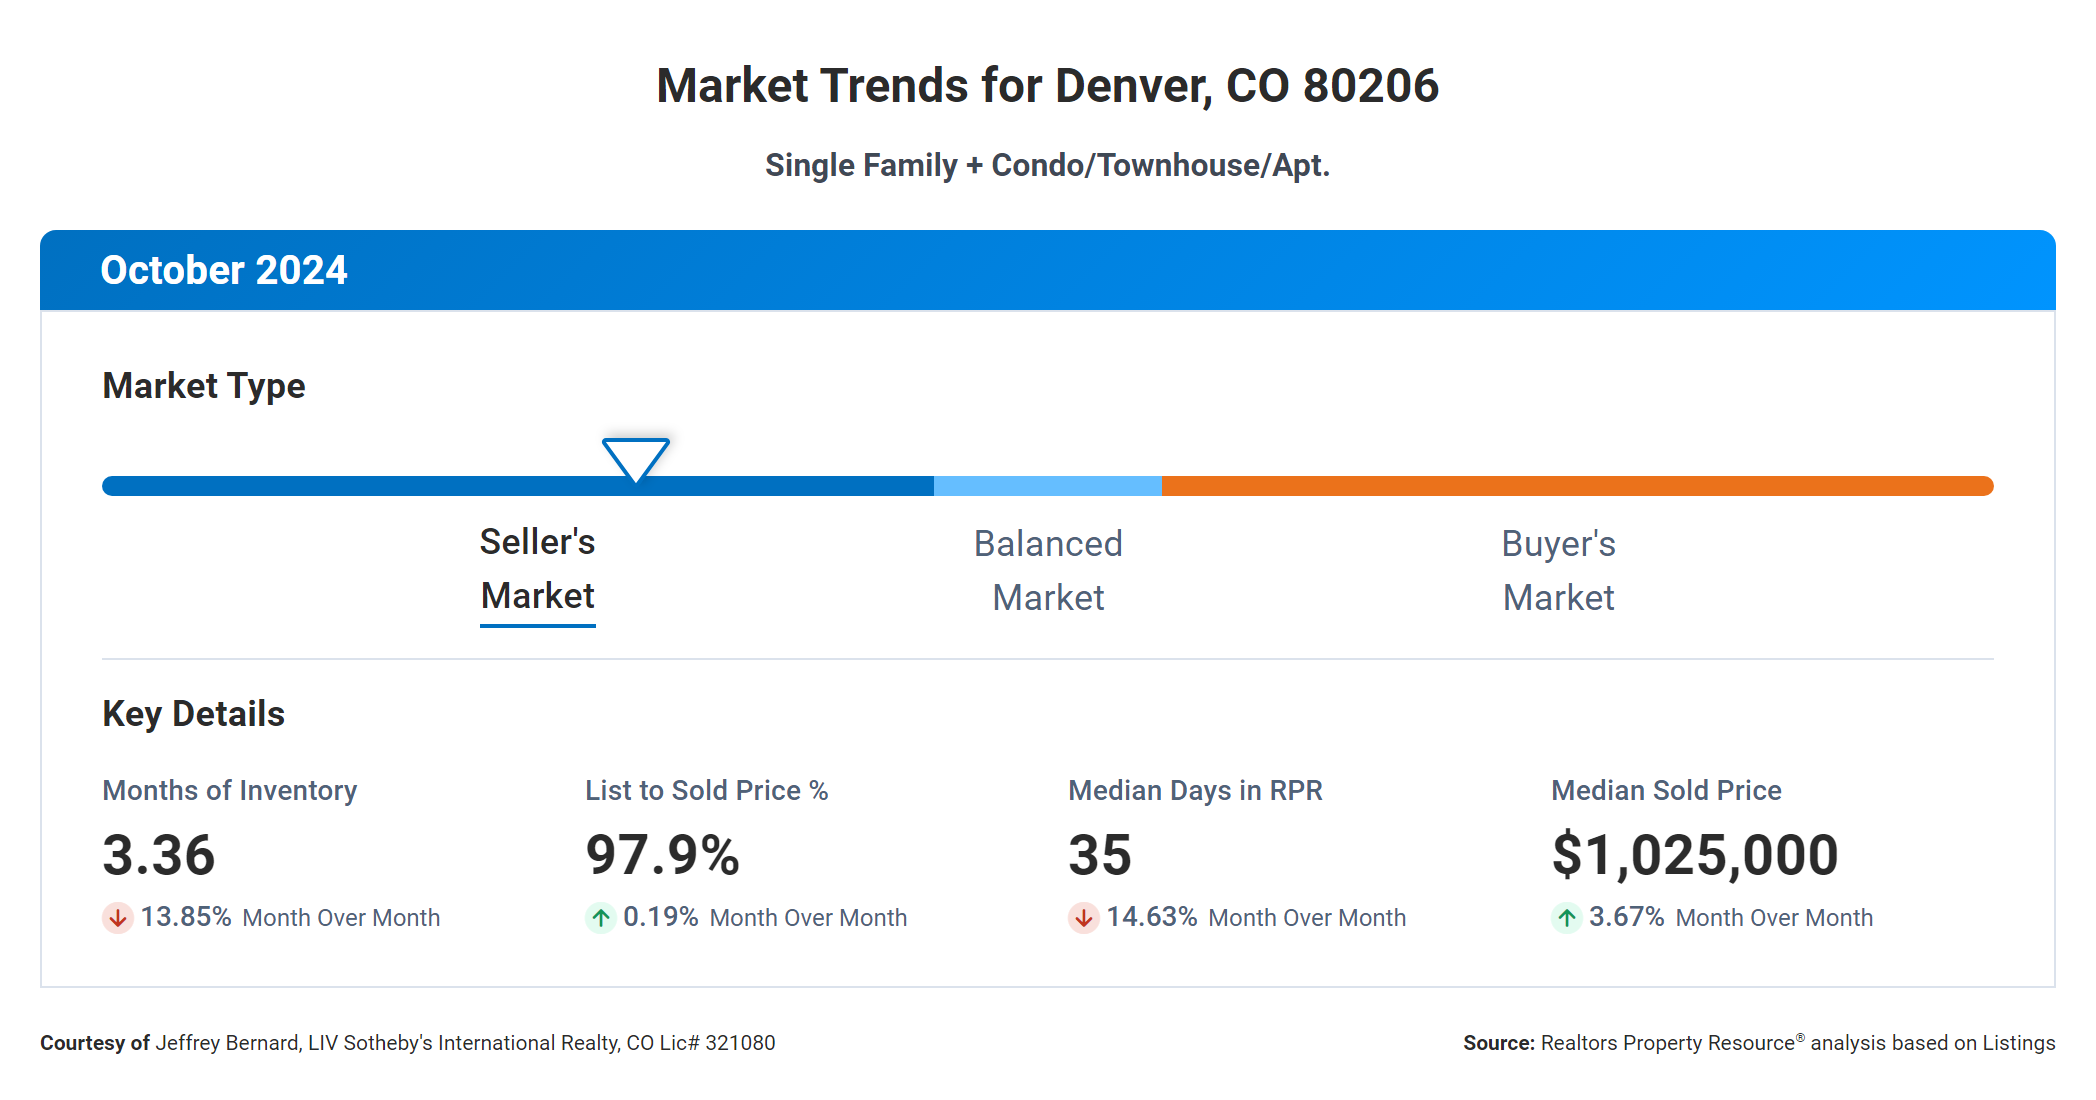
First, we have the Months’ Supply of Inventory, which is 3.36. This tells us how long it would take for all the current homes on the market to be sold at the current pace of sales. A relatively low number, like 3.36, indicates a seller’s market where demand exceeds supply.
Next, look at the 12-month Change in Months of Inventory at -0.88%. This negative percentage tells us that the supply of homes on the market is decreasing compared to a year ago. This could be due to increased demand or a need for new listings.
Now, onto the Median Days Homes are On the Market, which is 35. This quick turnaround time for selling homes indicates a fast-moving market where properties are being snatched up quickly.
Moving on to the List-to-Sold Price Percentage, which is at 97.9%, this means that homes typically sell for almost the total asking price, showing strong negotiation power for sellers.
Lastly, we have the Median Sold Price of $1,025,000. This gives us an idea of the average price of homes being sold in the market. A higher median sold price can signify a strong market with high demand.
These metrics show a competitive real estate market with low inventory, quick sales, and high prices. Whether you’re looking to buy or sell, understanding these trends can help you navigate the market successfully. Happy house hunting or selling!